
The following is a slow-update copy of the displays in the front of the 108A Marksbury machine room.
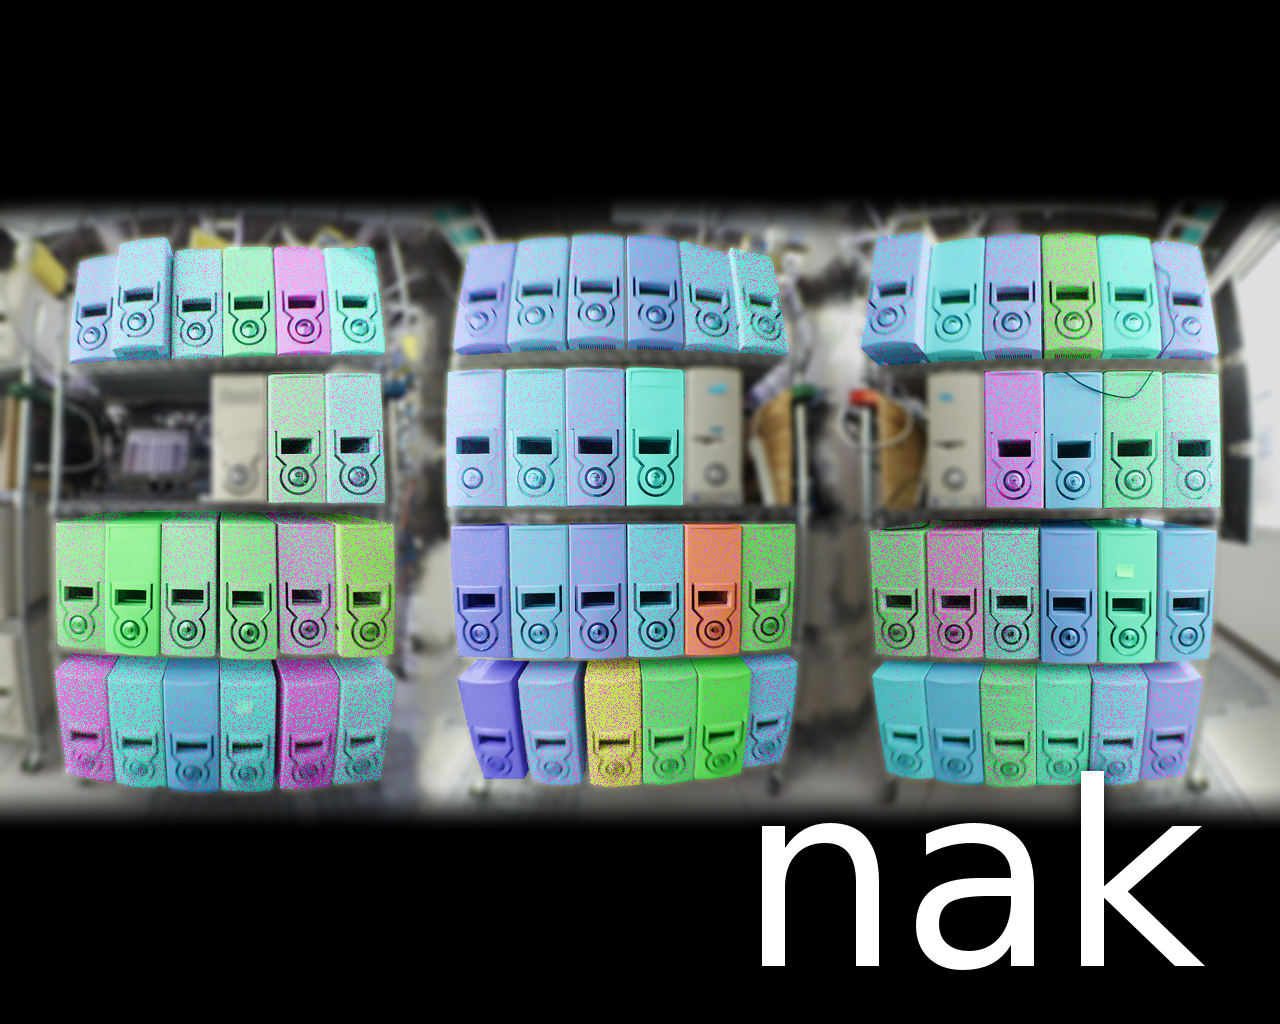


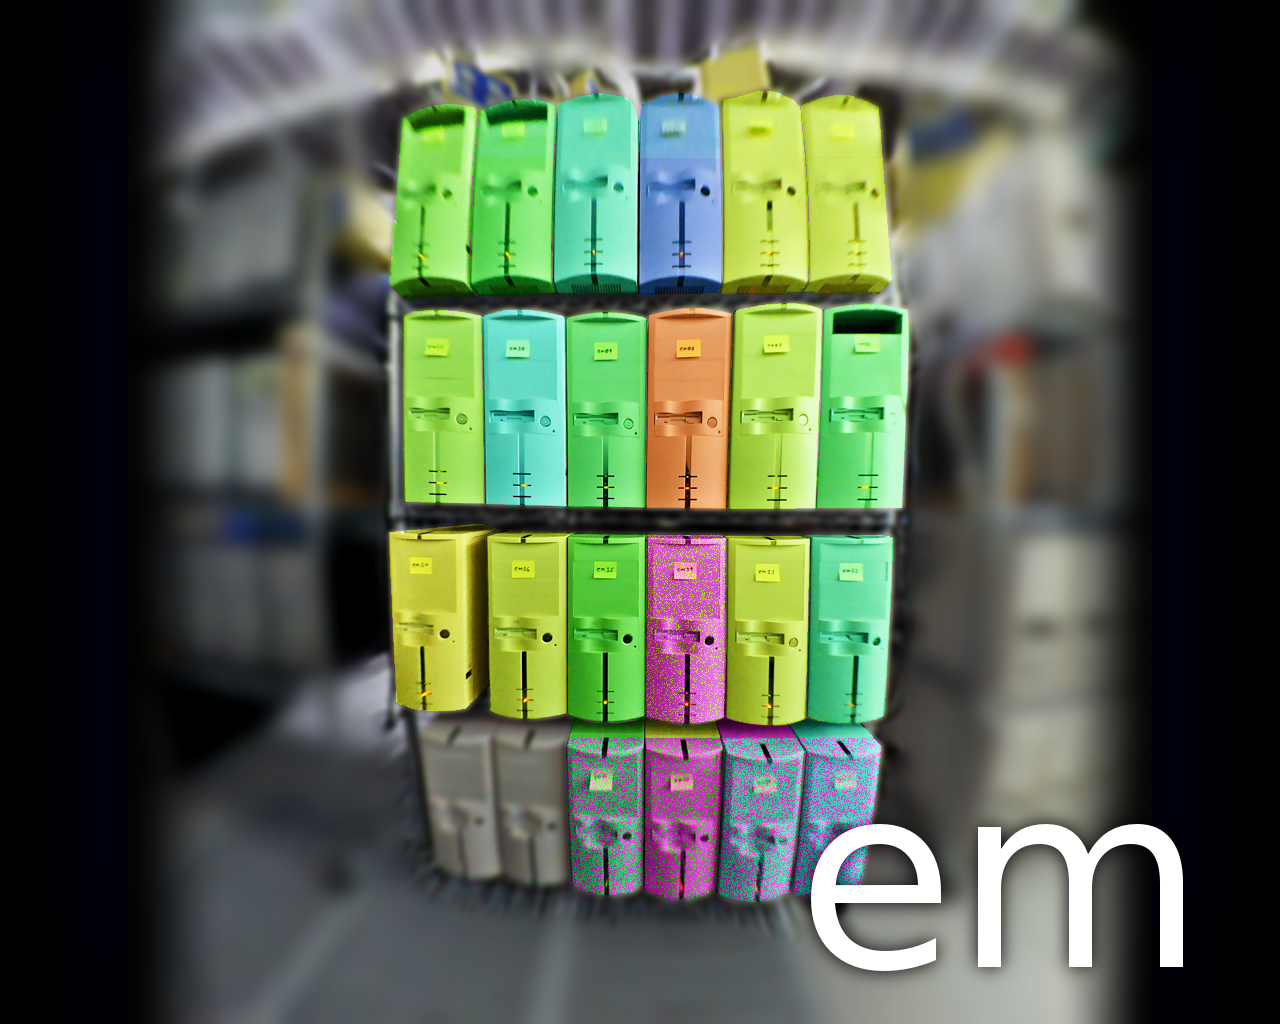
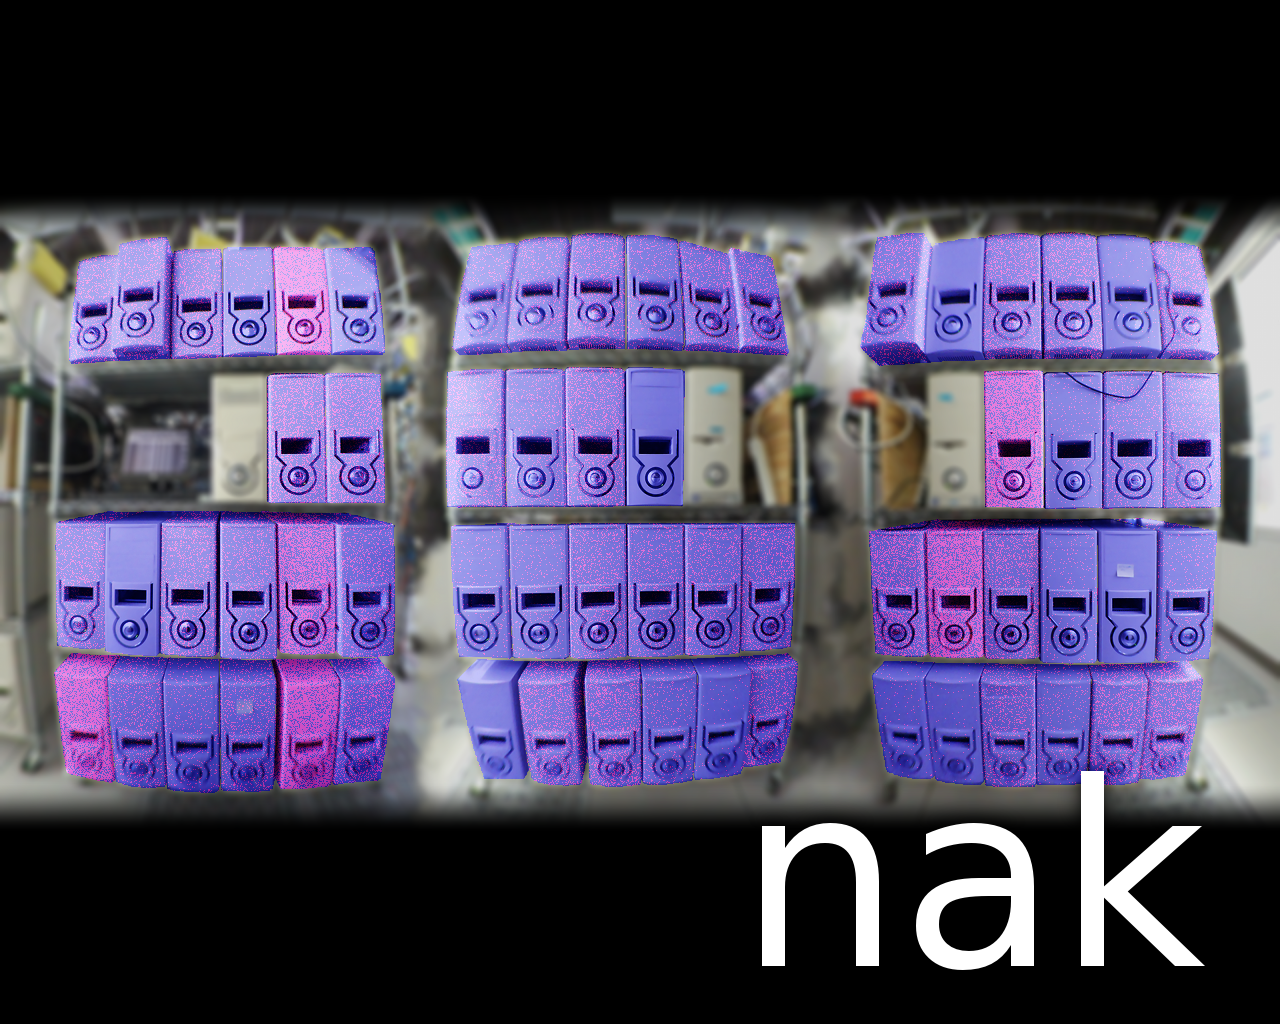
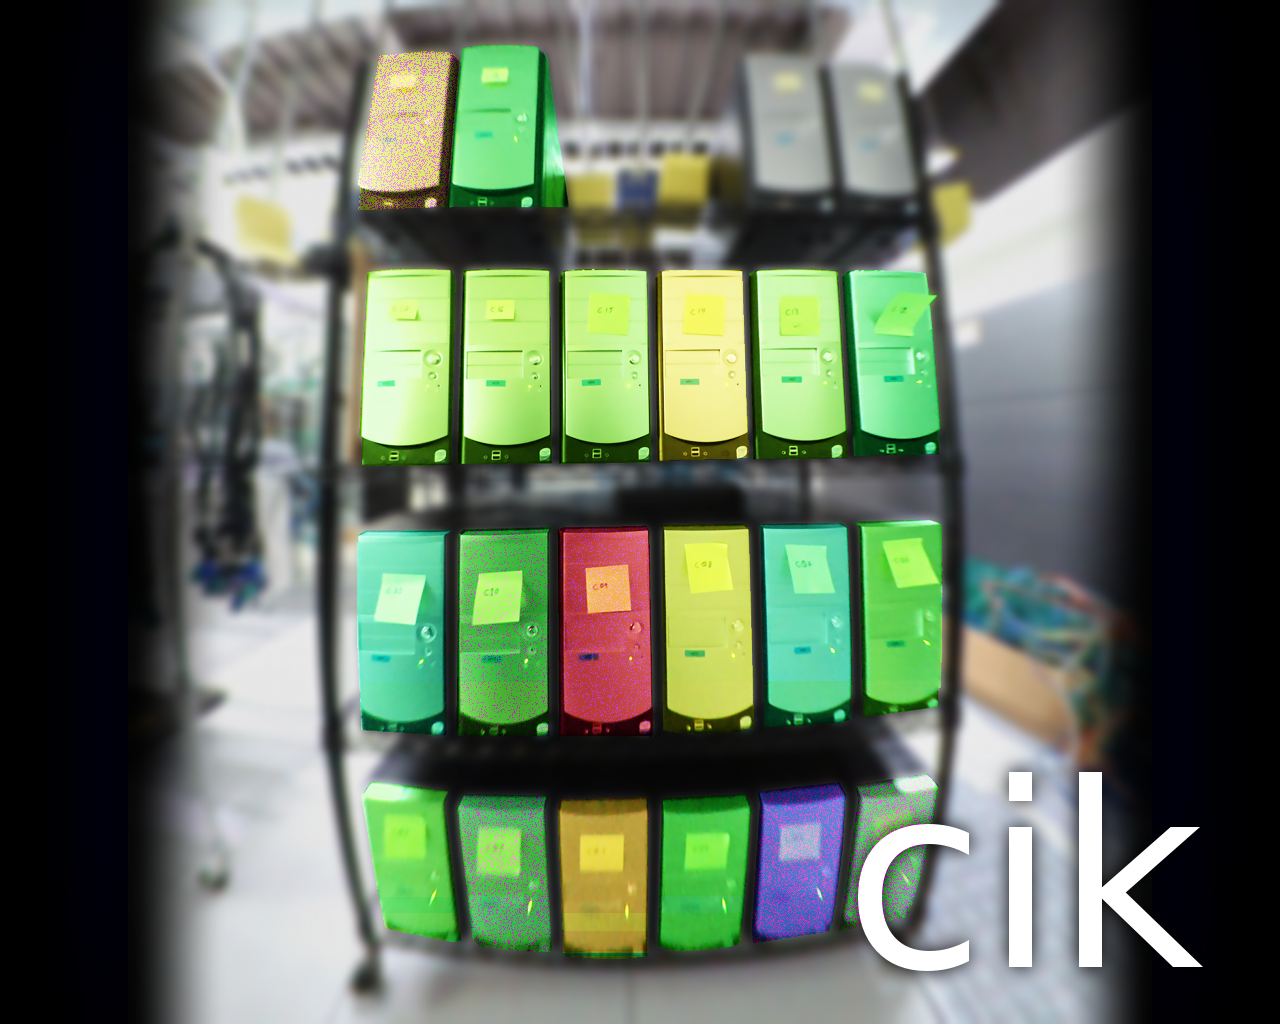
In case you're wondering where nodescape came from, we wrote it. It is a fairly straightforward application of the basic concepts of Senscape.Org to the problem of visualizing properties of cluster supercomputer nodes. The color tints of the nodes, from blue-to-green-to-red, represent the relative temperature (red is hot). Magenta indicates that no new status data has been obtained from that node for a while.
![]() The only thing set in stone is our name.
The only thing set in stone is our name.